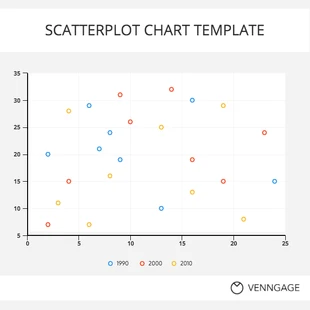
We use essential cookies to make Venngage work. By clicking “Accept All Cookies”, you agree to the storing of cookies on your device to enhance site navigation, analyze site usage, and assist in our marketing efforts.

Manage Cookies

Cookies and similar technologies collect certain information about how you’re using our website. Some of them are essential, and without them you wouldn’t be able to use Venngage. But others are optional, and you get to choose whether we use them or not.

Strictly Necessary Cookies

Always Active

These cookies are always on, as they’re essential for making Venngage work, and making it safe. Without these cookies, services you’ve asked for can’t be provided.

Show cookie providers

  • Venngage
  • Amazon
  • Google Login
  • Intercom

Functionality Cookies

These cookies help us provide enhanced functionality and personalisation, and remember your settings. They may be set by us or by third party providers.

Show cookie providers

  • Venngage
  • Chameleon
  • Intercom
  • Algolia

Performance Cookies

These cookies help us analyze how many people are using Venngage, where they come from and how they're using it. If you opt out of these cookies, we can’t get feedback to make Venngage better for you and all our users.

Show cookie providers

  • Venngage
  • Mixpanel
  • Intercom
  • Google Analytics
  • Hotjar

Targeting Cookies

These cookies are set by our advertising partners to track your activity and show you relevant Venngage ads on other sites as you browse the internet.

Show cookie providers

  • Google Ads
  • Google Tag Manager
  • Facebook
  • Pinterest
Plot Chart Template

Plot Chart Template

Get to know an easy to use and customize plot chart template with Venngage plot chart template

The Venngage plot chart template is a great template to use for data-related presentations. It helps you quickly turn your data into beautiful, fully customizable plots that are easy to share and export. Venngage creates a chart in just a few clicks and is available for free. You can use Venngage for all sorts of projects, whether you're doing data analysis or creating a chart for your next presentation. Venngage has plenty of customizable templates to choose from, so it's easy to turn your raw data into an infographic in no time, saving you time and energy. Venngage is available both online and as an Excel template. Venngage can help you create visuals that clearly display your data, making it easier than ever before to turn your spreadsheet into a better-looking infographic. If you have no design experience, Venngage is a website that can help you create a visual with just a few clicks. To get started, click the "Start a Plot Chart" button in the Venngage editor. After clicking "Start a Plot Chart," please proceed to input data on each row of the plot chart. Choose fonts that suit the tone of your design. Stick to 2-3 fonts for your design, keeps your design looking organized and professional. You can always use different styles and sizes for more variation in your design. For those who want to flex their creativity, create your own icons by pairing individuals icons together to create icon scenes. Consider your data and what charts are best for representing it. Use contrasting colors in your pie charts or bar graphs to help make data points distinct. Provide spacing around your chart, clear labels and headers so that they are easy to understand. Emphasize important data points with high-contrast colors, or additional text. Feel free to get creative and think of new combinations. Venngage has hundreds of unique fonts, we have font styles that can be included in My Brand Kit, It's easy to upload your own images in the editor and crop them using presets, the editor is intuitive and all tools are accessible from a sidebar for quick access, you can choose from a large library of clipart images or upload your own, It's easy to share and download an image of your infographic. Venngage is a cloud-based infographics tool that helps individuals create professional looking images in minutes. The Venngage plot chart template is really simple to use, and it can be quickly edited with Venngage (no software necessary). With ease and no design experience, Venngage will make your charts come alive! You can use page resize to automate resizing. You can do it manually by applying new dimensions to the template. You can download designs as PNGs, HD PNGs, PDFs, Interactive PDFs (clickable hyperlinks that are external, or within the document), PowerPoint for presentations, HTML for email newsletters (an option for creating email newsletter designs that have hyperlinks and buttons). For printing designs, you can apply print bleed. Get started with Venngage's plot chart template today!


The Venngage plot chart template is a great template to use for data-related presentations. It helps you quickly turn your data into beautiful, fully customizable plots that are easy to share and export. Venngage creates a chart in just a few clicks and is available for free. You can use Venngage for all sorts of projects, whether you're doing data analysis or creating a chart for your next presentation. Venngage has plenty of customizable templates to choose from, so it's easy to turn your raw data into an infographic in no time, saving you time and energy. Venngage is available both online and as an Excel template. Venngage can help you create visuals that clearly display your data, making it easier than ever before to turn your spreadsheet into a better-looking infographic. If you have no design experience, Venngage is a website that can help you create a visual with just a few clicks. To get started, click the "Start a Plot Chart" button in the Venngage editor. After clicking "Start a Plot Chart," please proceed to input data on each row of the plot chart. Choose fonts that suit the tone of your design. Stick to 2-3 fonts for your design, keeps your design looking organized and professional. You can always use different styles and sizes for more variation in your design. For those who want to flex their creativity, create your own icons by pairing individuals icons together to create icon scenes. Consider your data and what charts are best for representing it. Use contrasting colors in your pie charts or bar graphs to help make data points distinct. Provide spacing around your chart, clear labels and headers so that they are easy to understand. Emphasize important data points with high-contrast colors, or additional text. Feel free to get creative and think of new combinations. Venngage has hundreds of unique fonts, we have font styles that can be included in My Brand Kit, It's easy to upload your own images in the editor and crop them using presets, the editor is intuitive and all tools are accessible from a sidebar for quick access, you can choose from a large library of clipart images or upload your own, It's easy to share and download an image of your infographic. Venngage is a cloud-based infographics tool that helps individuals create professional looking images in minutes. The Venngage plot chart template is really simple to use, and it can be quickly edited with Venngage (no software necessary). With ease and no design experience, Venngage will make your charts come alive! You can use page resize to automate resizing. You can do it manually by applying new dimensions to the template. You can download designs as PNGs, HD PNGs, PDFs, Interactive PDFs (clickable hyperlinks that are external, or within the document), PowerPoint for presentations, HTML for email newsletters (an option for creating email newsletter designs that have hyperlinks and buttons). For printing designs, you can apply print bleed. Get started with Venngage's plot chart template today!